Client
Self-initiated
Year
2015
Team
Myself
Tasks
Concept, data visualization, UX, UI, front-end development
Visual literature
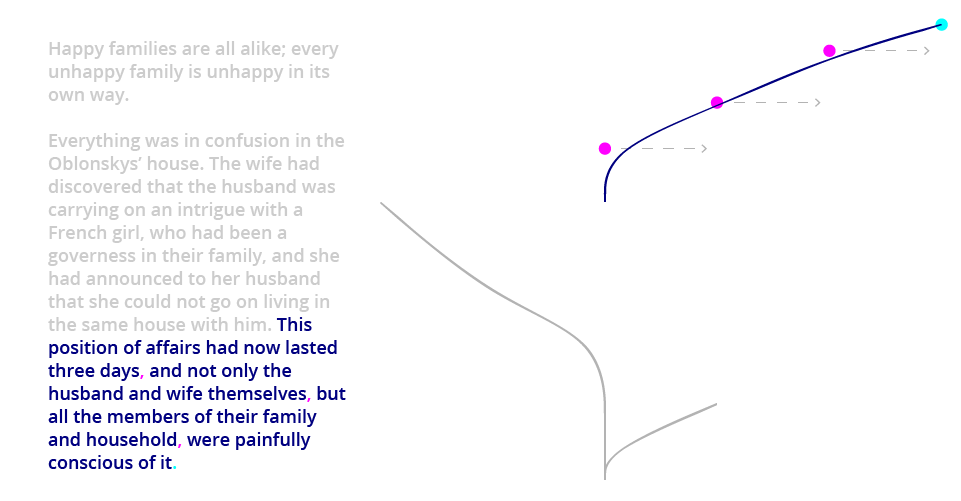
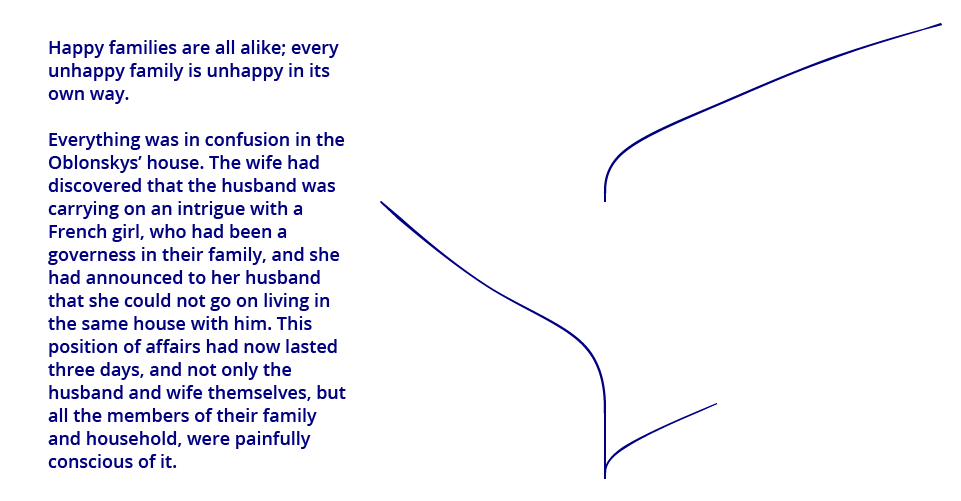
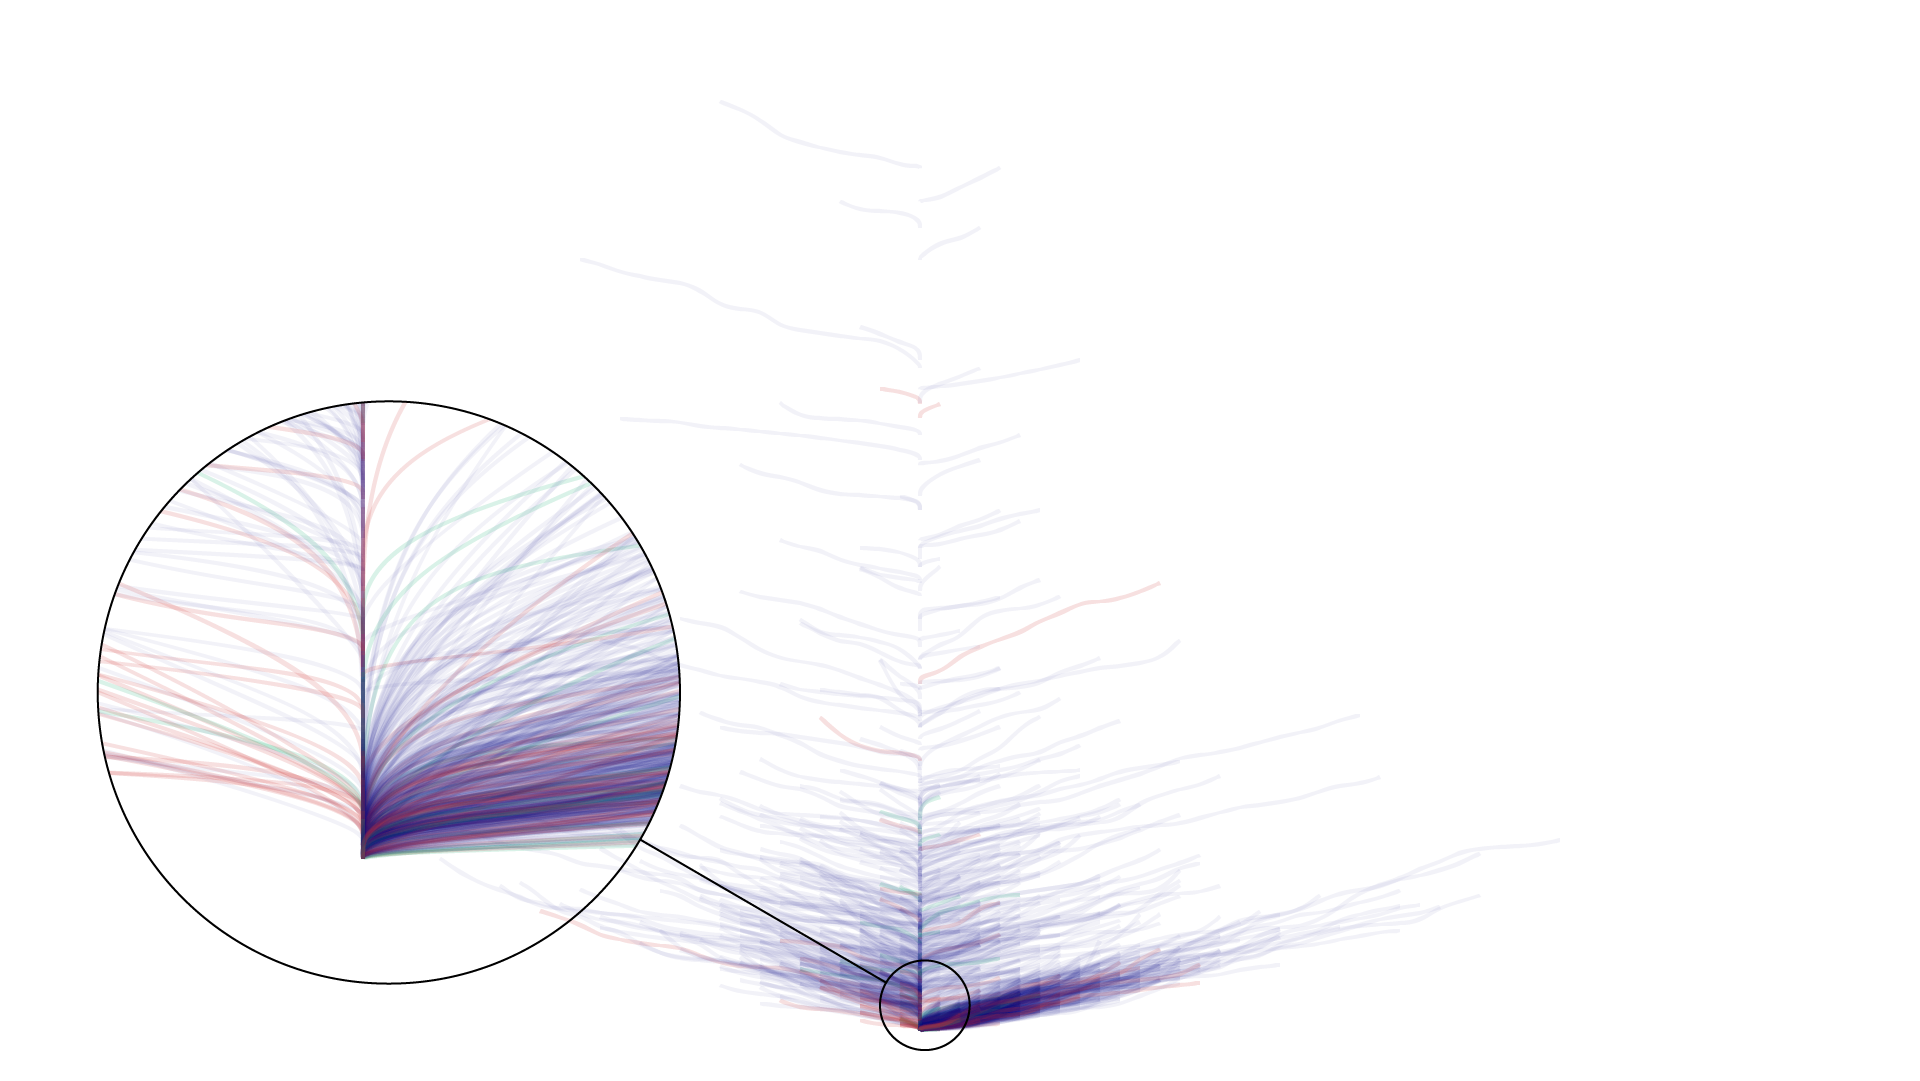
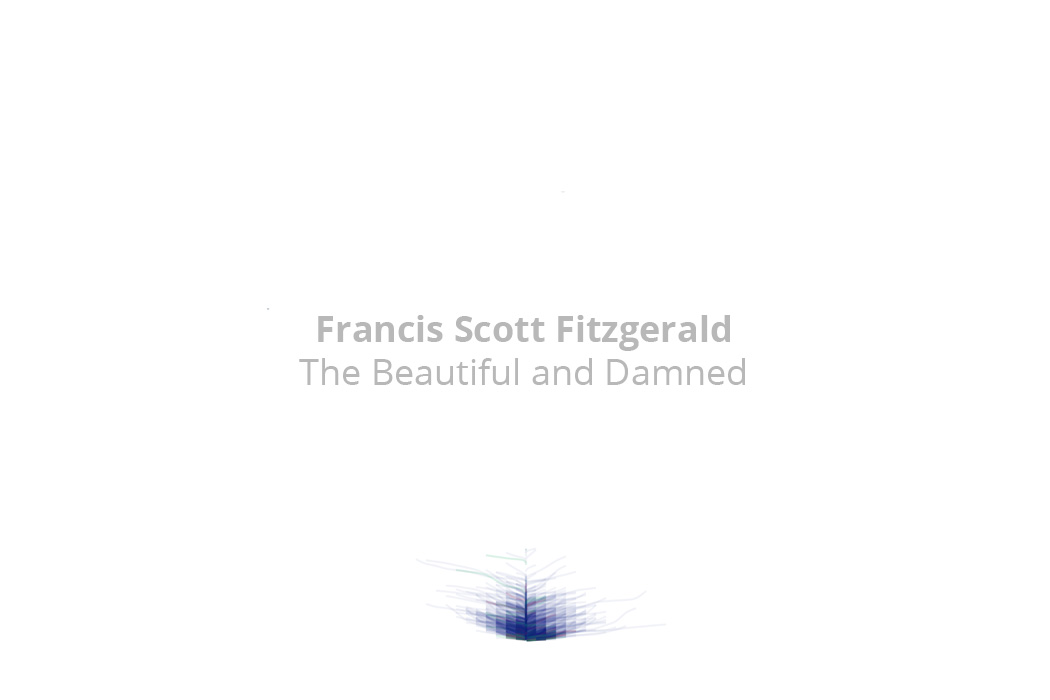
The project tries to visualize the writing style of an author through a diagram generated by the rhythm of the text.
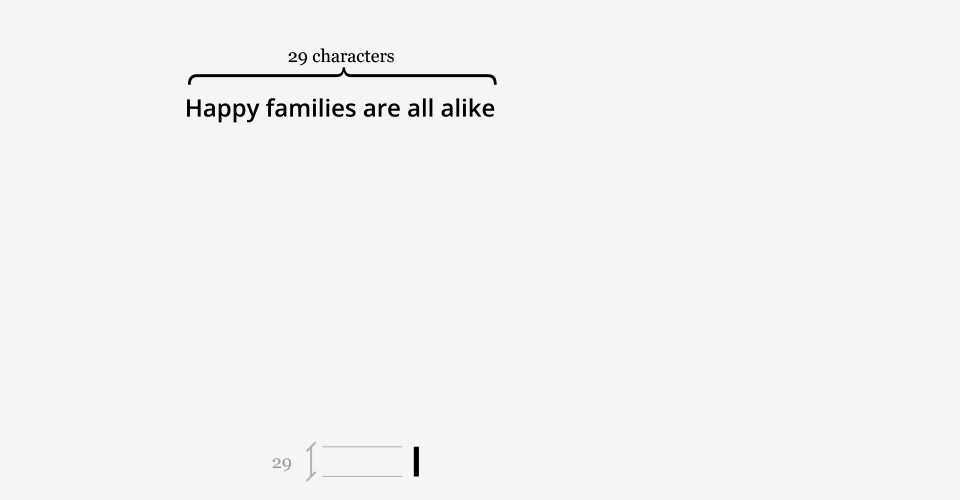
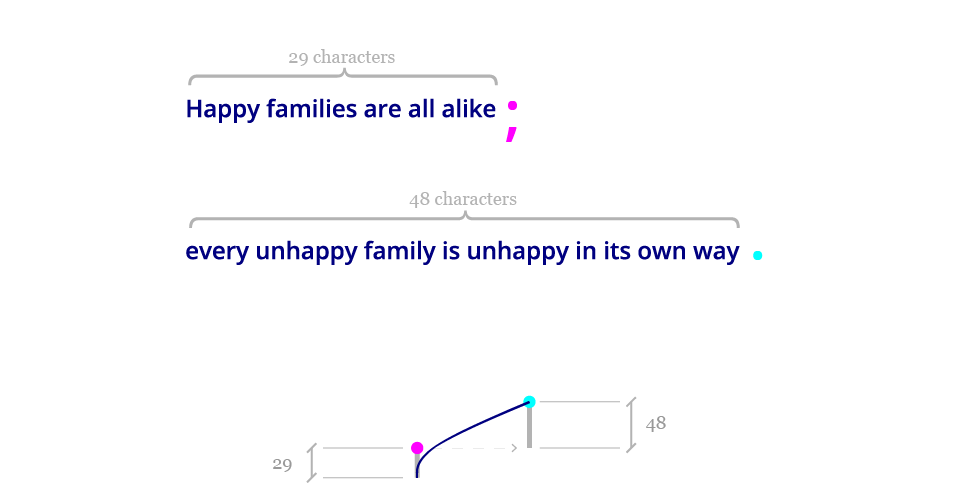
While the text is read from left to right, the diagram grows from bottom to top: a complex and articulated writing flow will produce a high and wide shape, while a blunt and concise prose will result in a smaller and sharper diagram.
The project
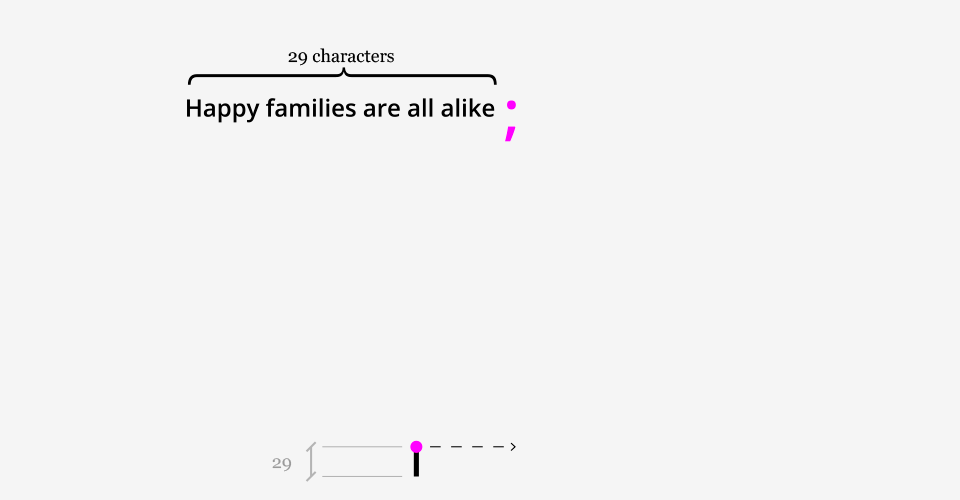
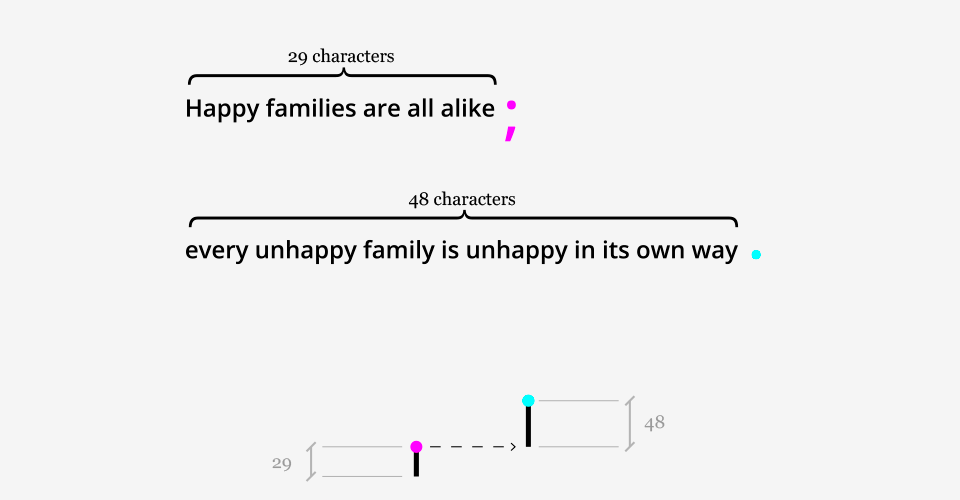
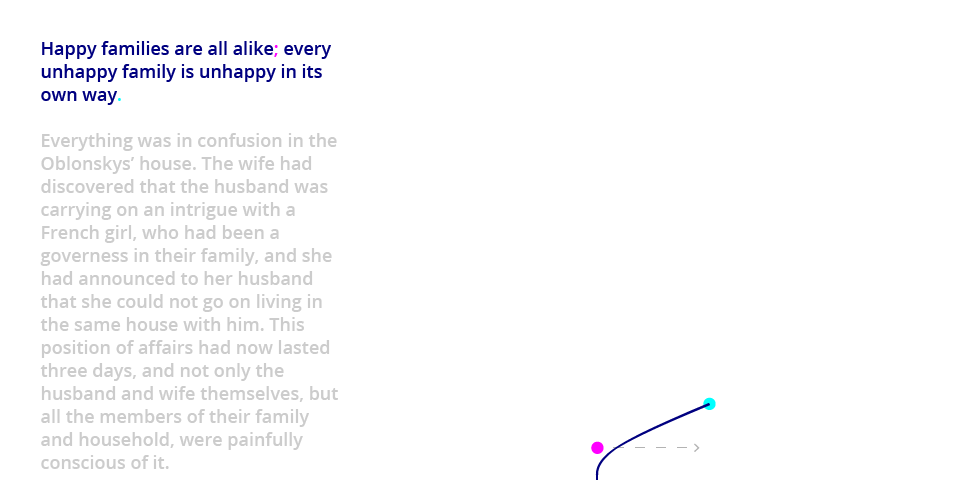
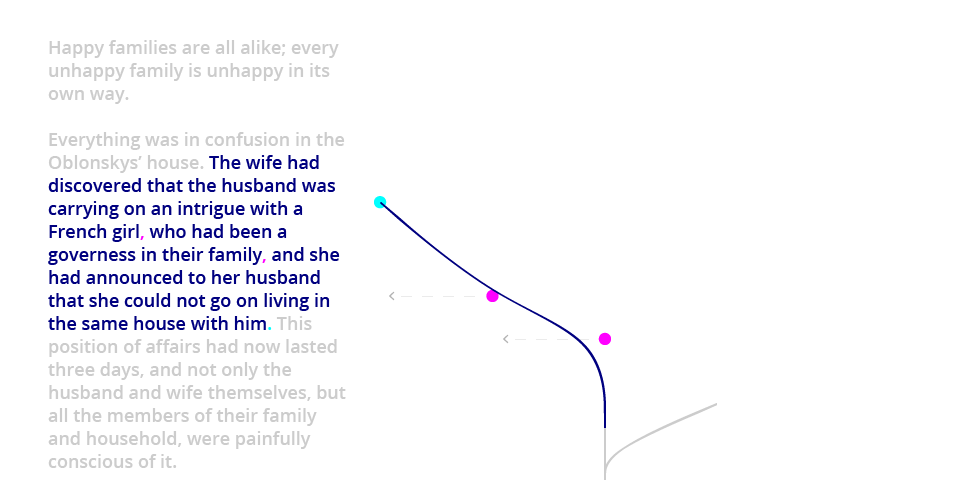
Each sentence is represented by a line: the longer the sentence, the longer the line. If there are no comas (, ; :) the line will be vertical; comas produce a drift from the central axes. Red and green represent respectively sentences ending with question and exclamation marks.
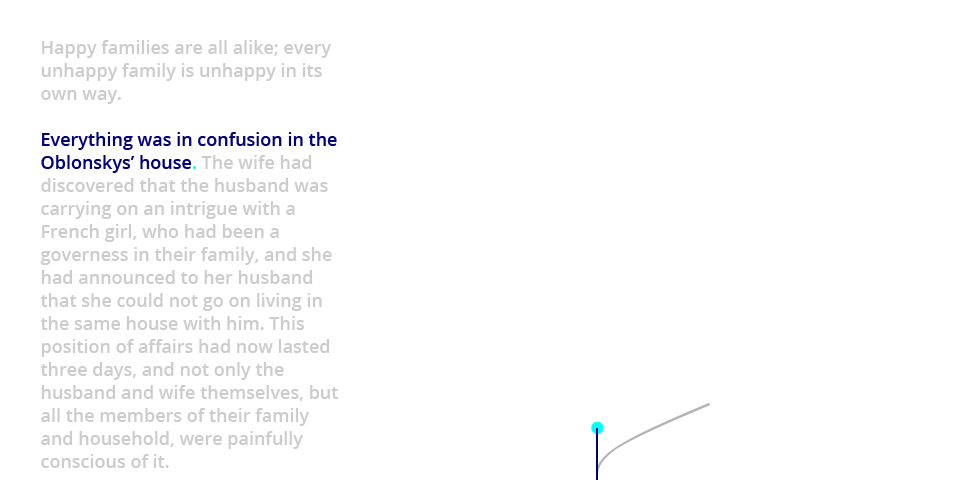
Each paragraph includes one to many sentences: it sprouts from a single point at the very bottom and grow up. The whole text is represented by the overlay of all the paragraphs.
The metaphor is pretty clear: the book grows as a tree, whose height depends on the paragraph length, and width on the sentence complexity.
The following section shows the 16 authors analysed: the first 100.000 characters of each book have been considered, using Project Gutemberg as data source.
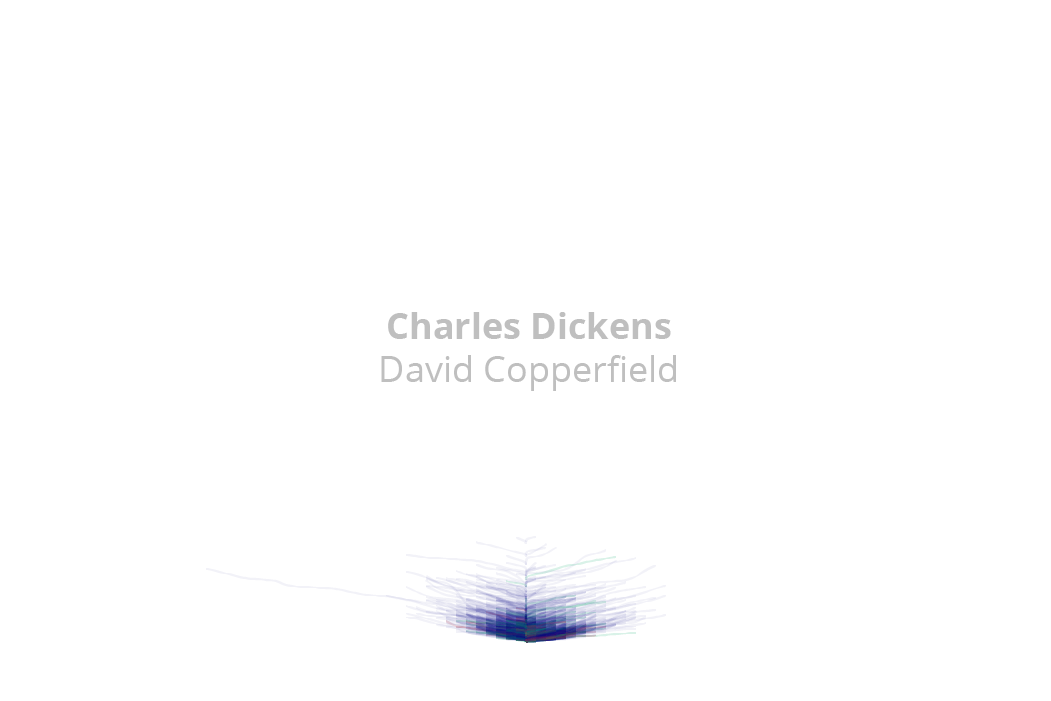
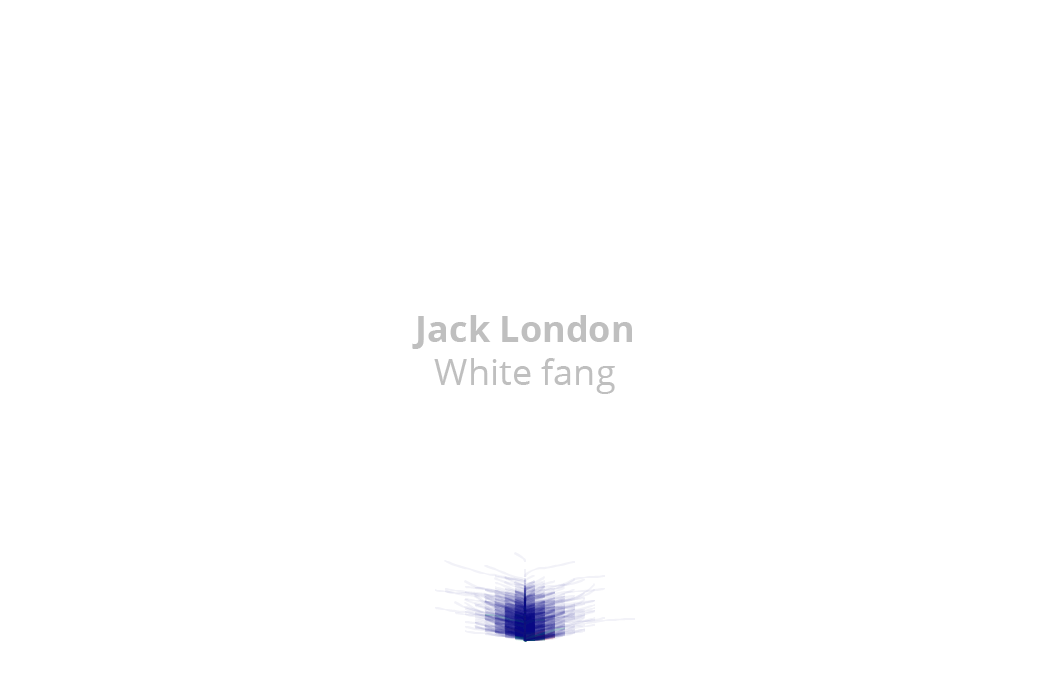
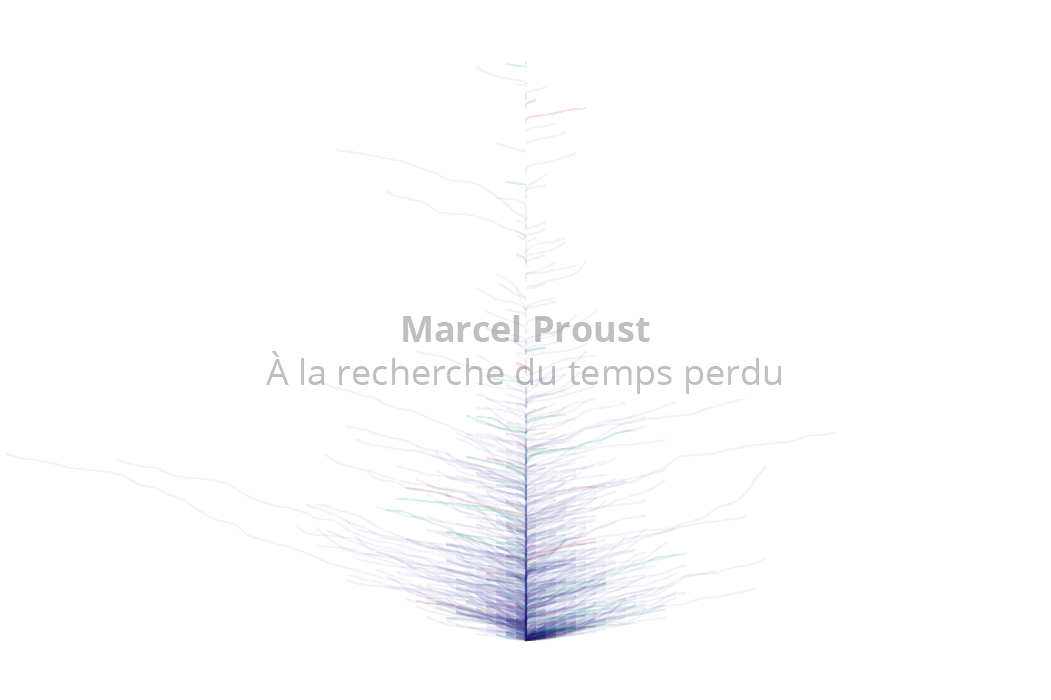
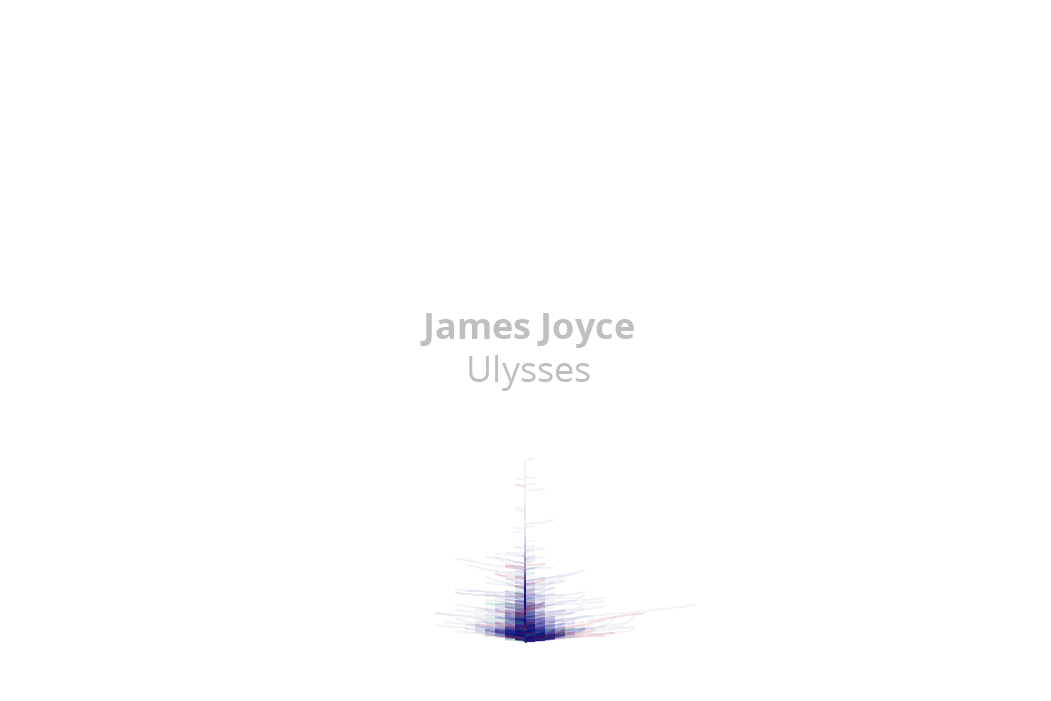
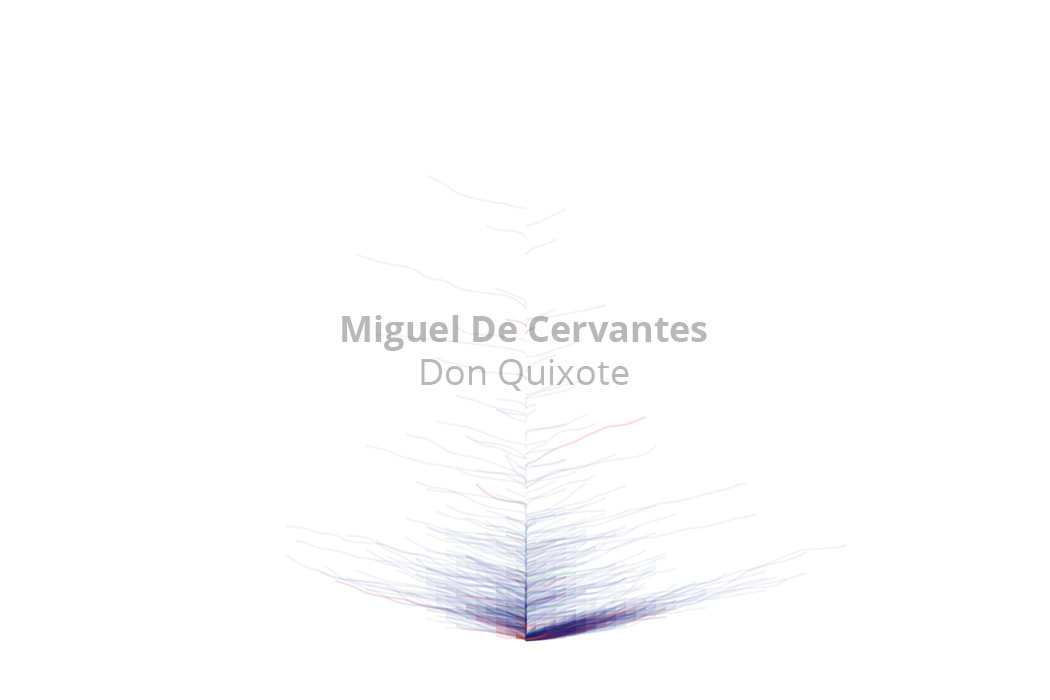
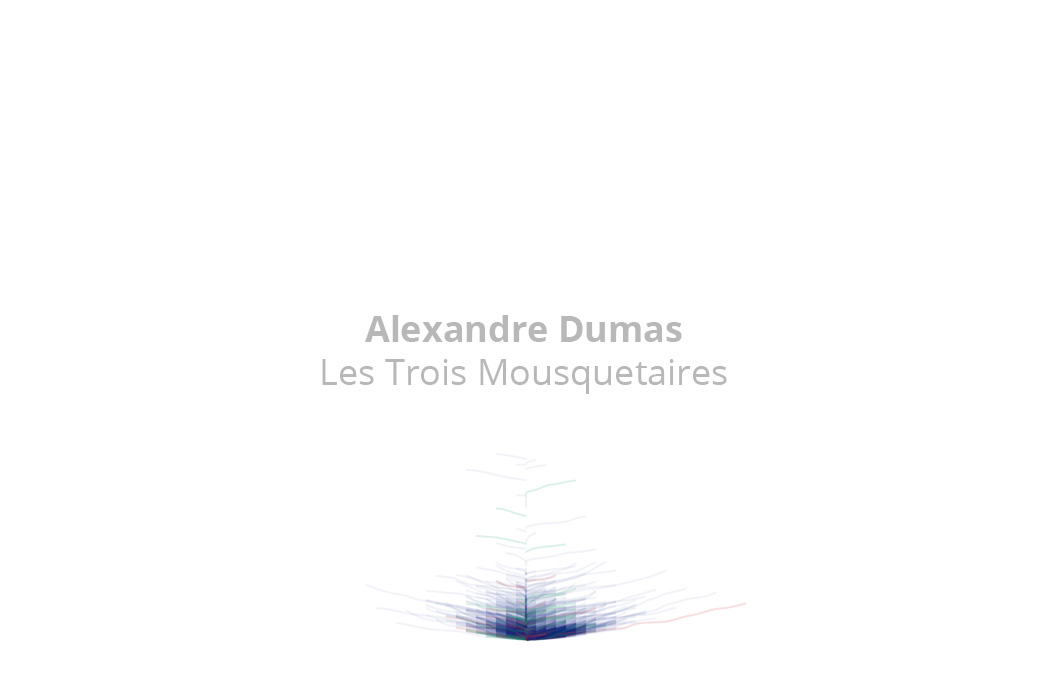
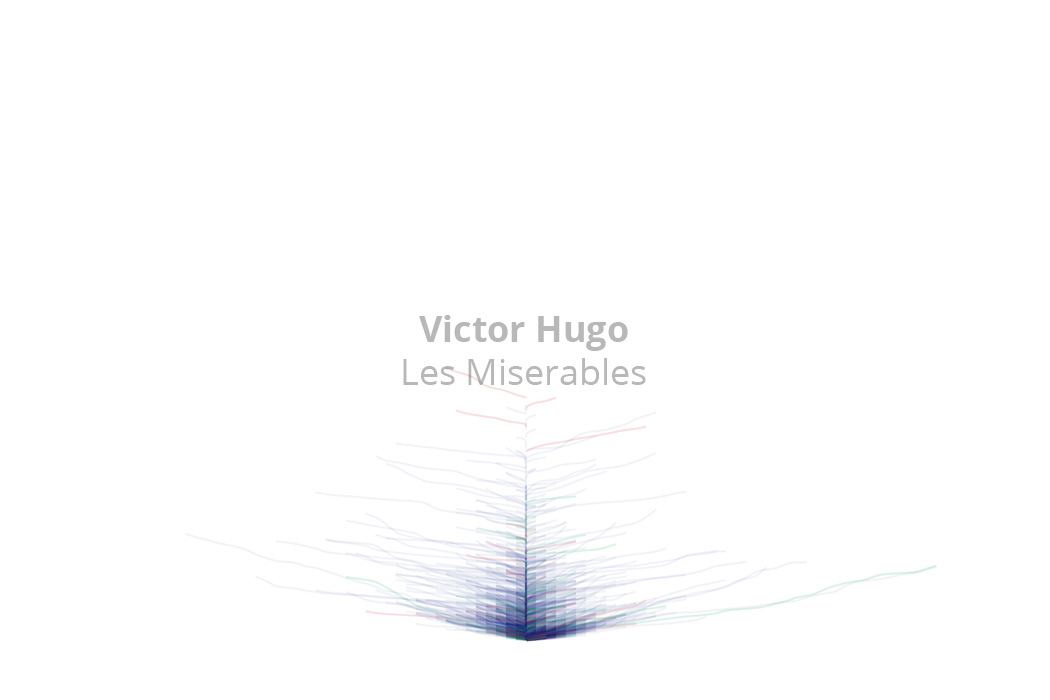
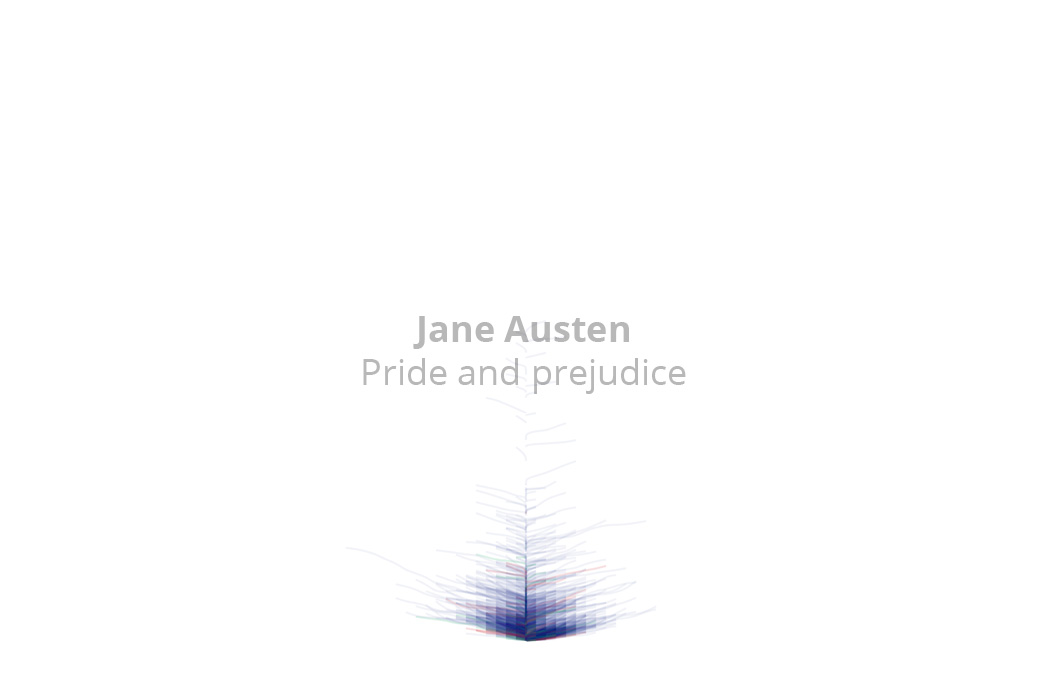
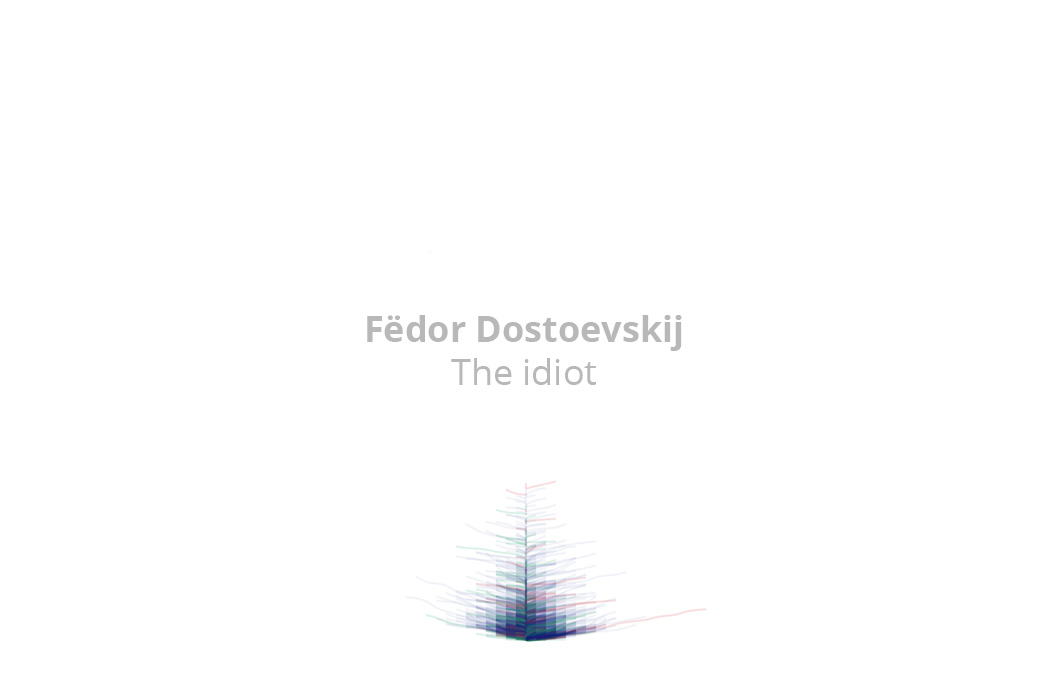
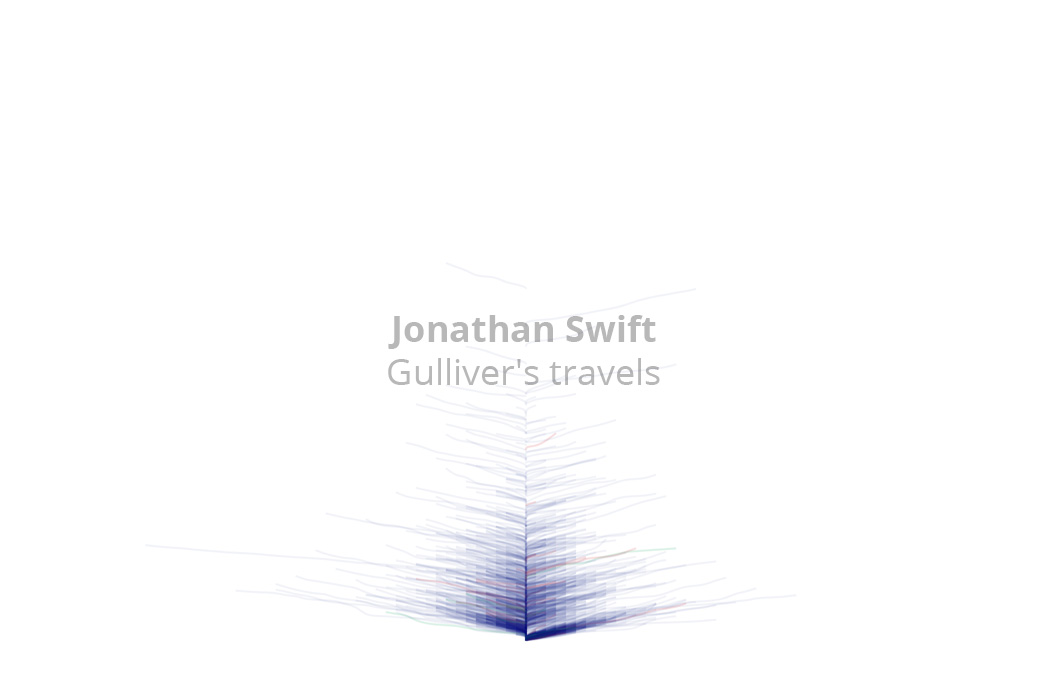
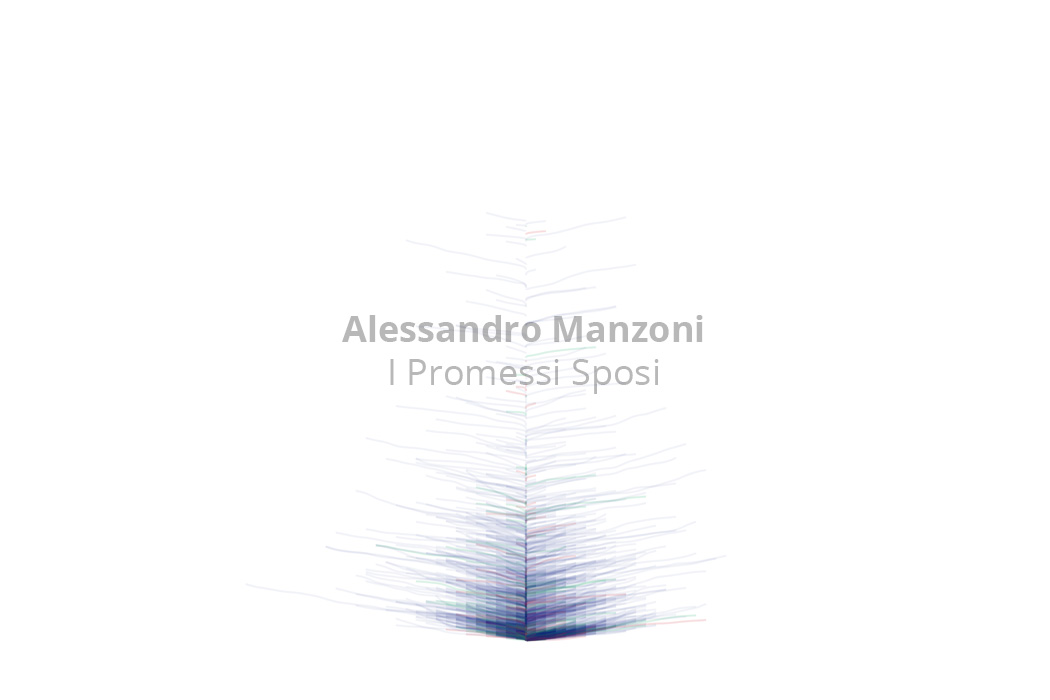
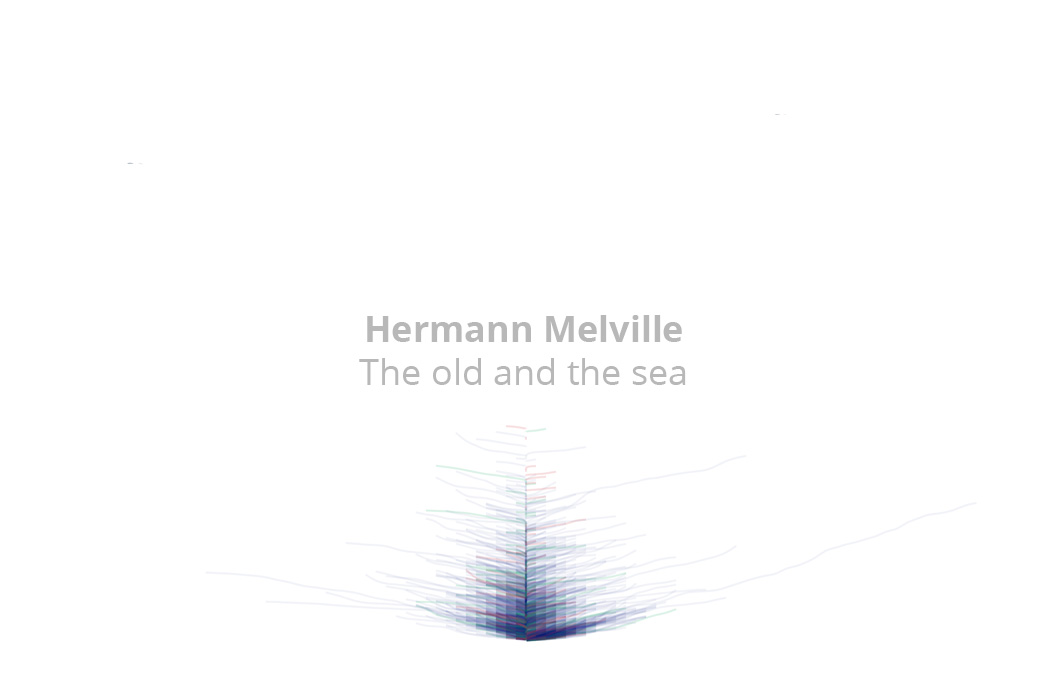
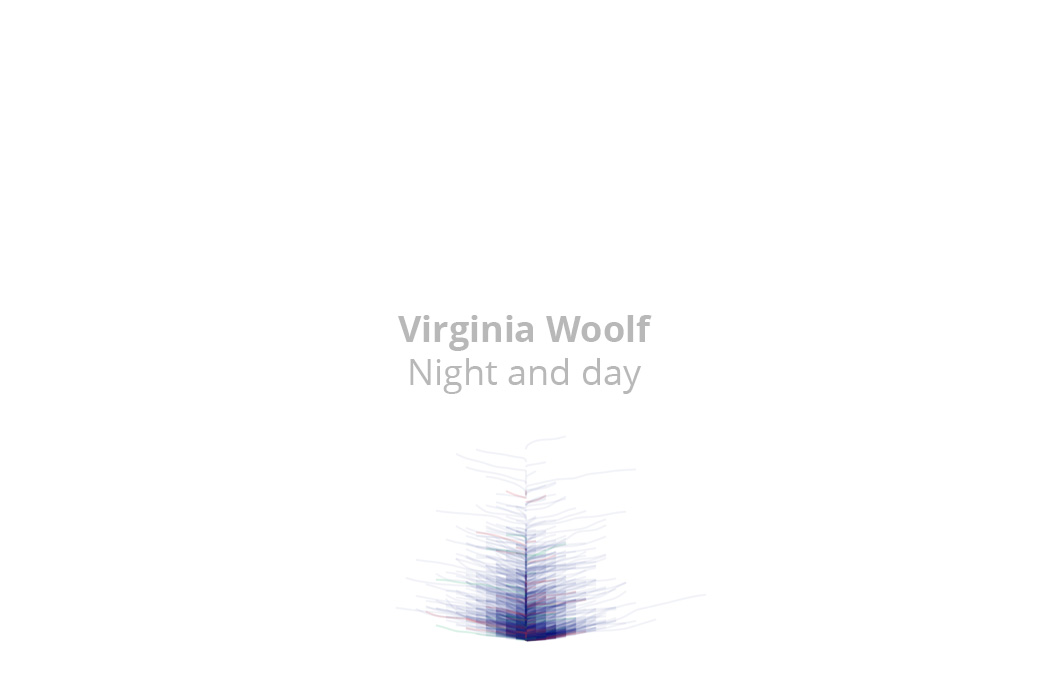
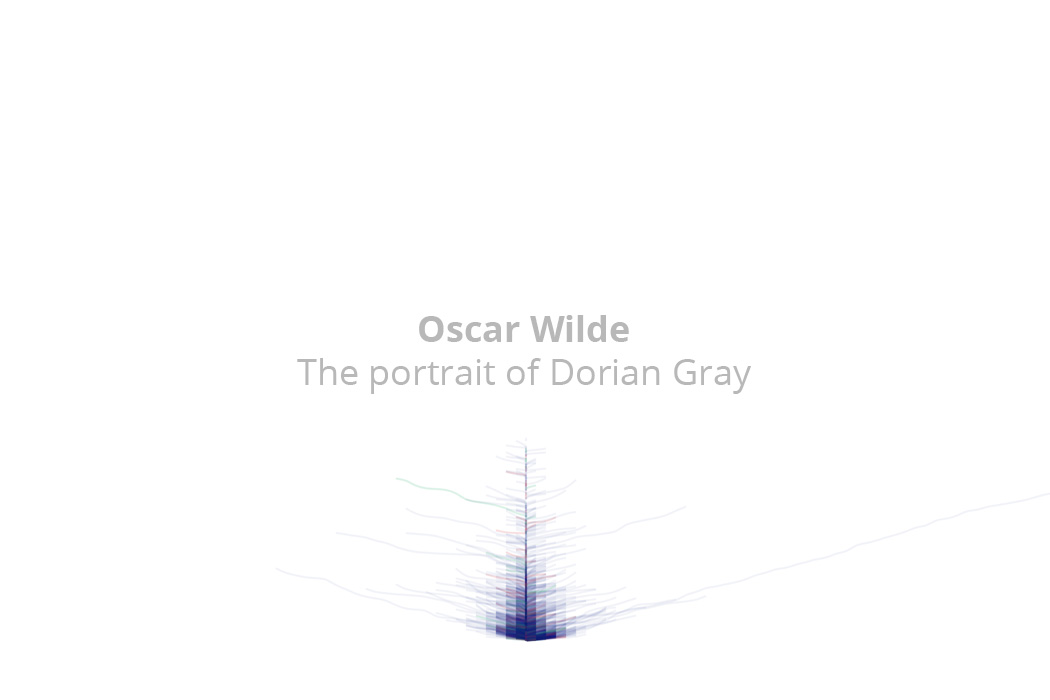
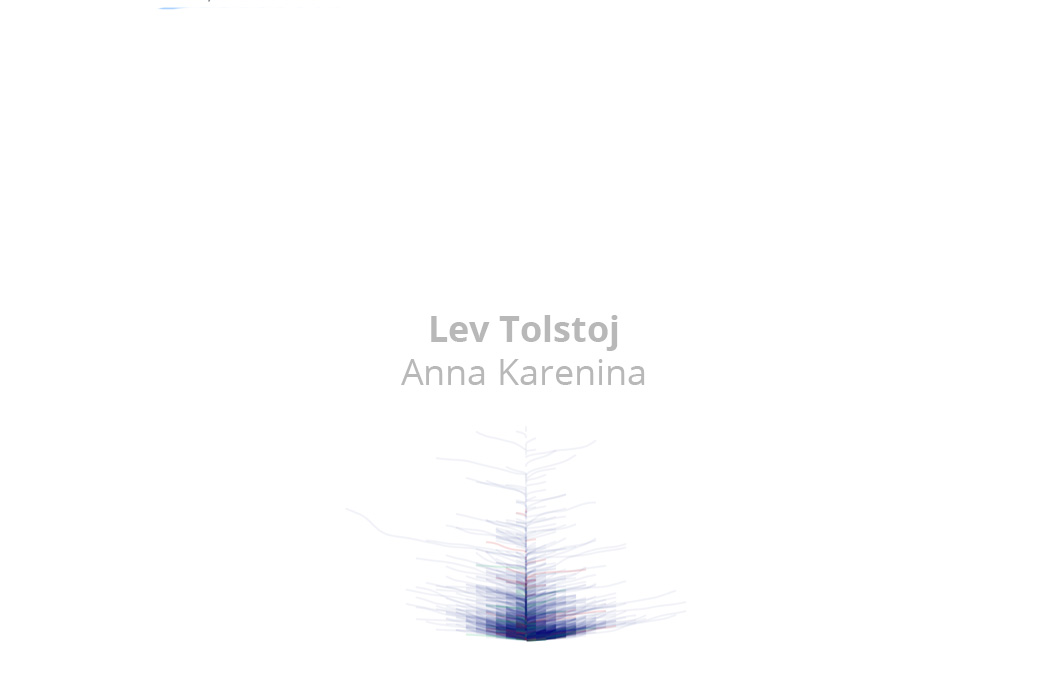
The differences among authors emerge pretty well, ranging from Jack London's very concise to Marcel Proust complex and structured style.
Process
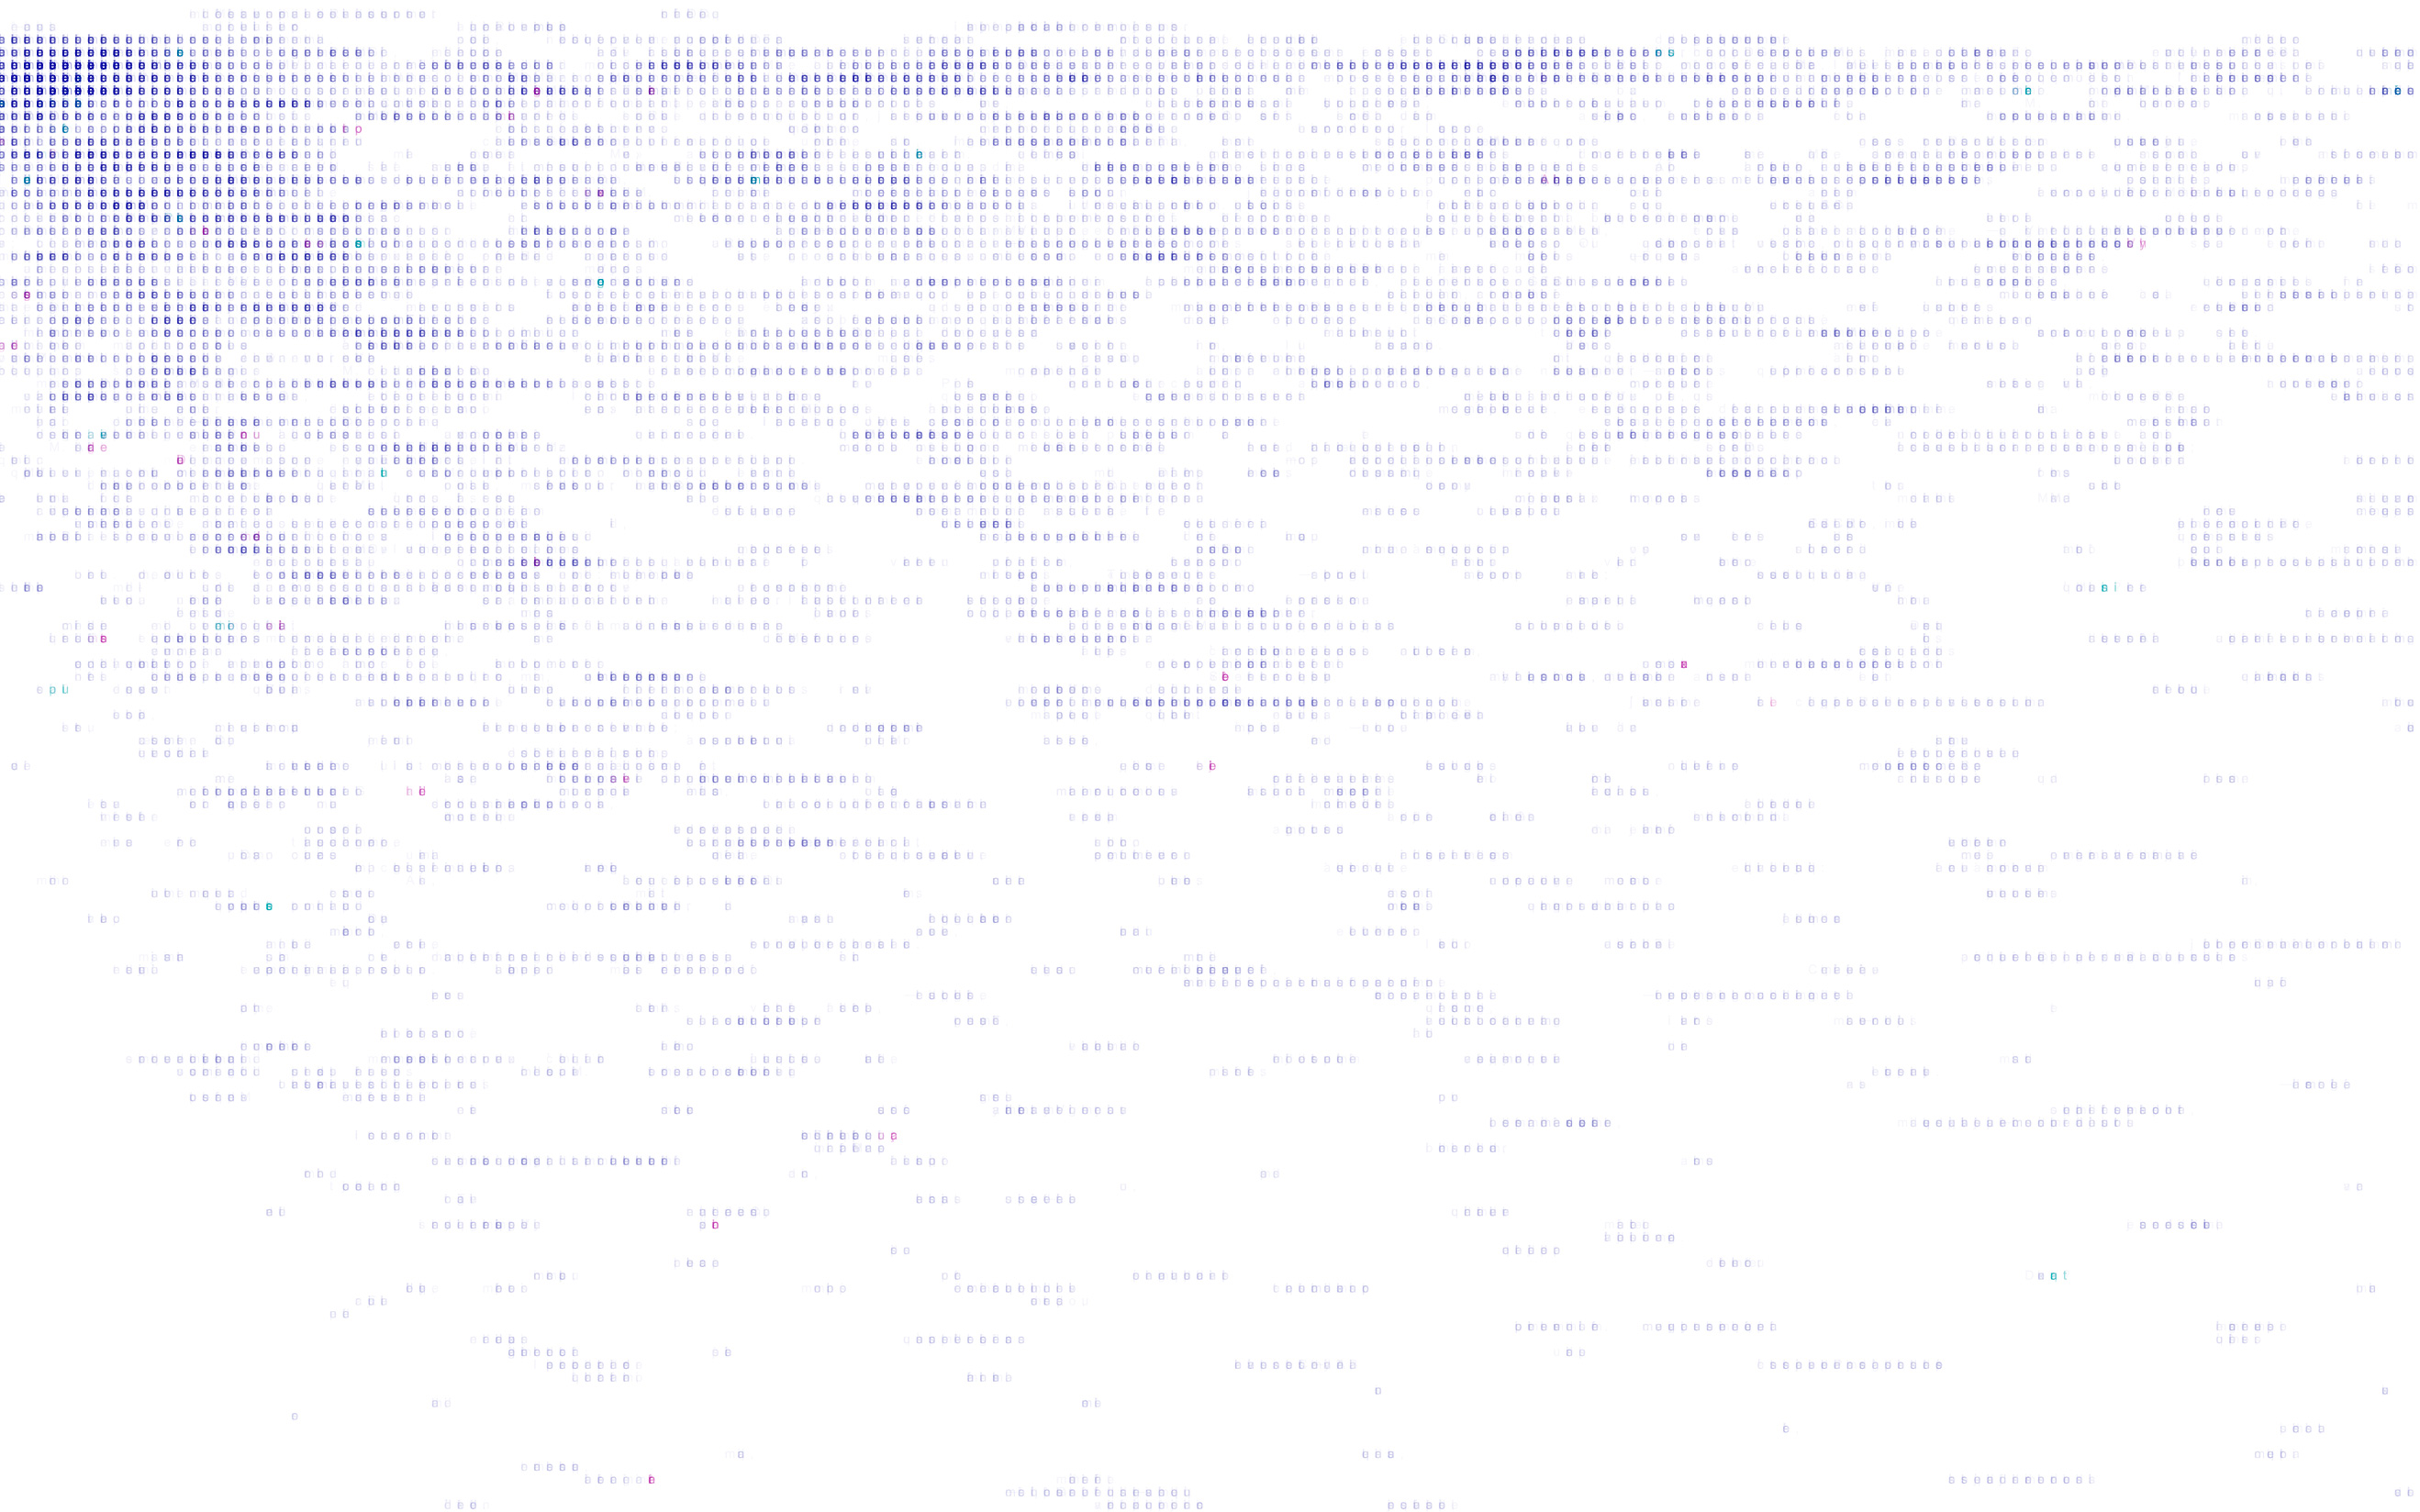
In a first static version of the project, developed with Processing, the elements building the structures were the letters of the book sentences, making the visual representation built of the “matter” itself under investigation.
The textures generated by the letters were very interesting, but moving to the web I needed to work with lighter and more manageable elements: this is the reason why the final version is made by curves.